ASTL Amreli Steels Limited Analysis 19 Dec. 2016
Rebound Insight
Amreli SteelsENGINEERING |
Price: 68.82Change: 0.12 2016-12-16 |
||||||
| Open: | 68.70 | 52 Week High: | 78.20 | Market Capitalization Mln: | 20440.33 | ||
|---|---|---|---|---|---|---|---|
| High: | 69.40 | 52 Week Low: | 42.65 | Outstanding Shares. Mln: | 297.01 | ||
| Low: | 68.01 | 52 Week Avg.: | 58.38 | KSE AllShares % Weight-age: | 0.22 | ||
| Close: | 68.82 | 52 Week Max Vol.: | 5702000 | KSE100 % Weight-age: | Not Listed | ||
| Average: | 68.73 | 52 Week Min Vol.: | 74500 | KSE30 % Weight-age: | Not Listed | ||
| Volume: | 309500 | 52 Week Total Vol.: | 266999000 | Data Last Updated: | 2016-12-16 | ||
Rebound Insight
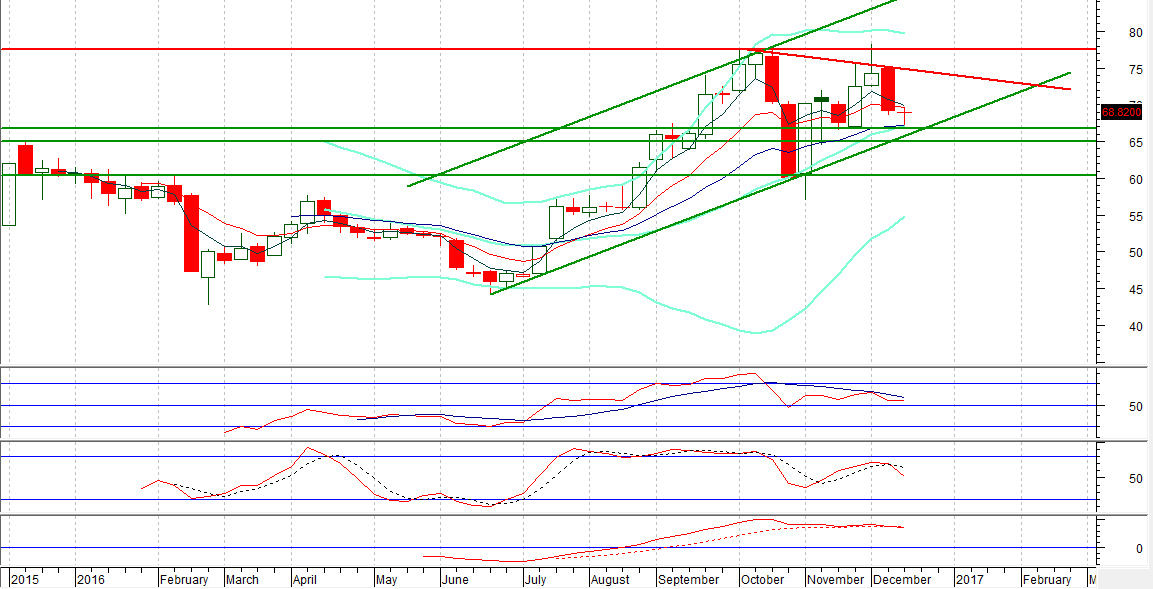
Our Pivot: 60.30
Our Preference: Buy ASTL above 66.85 and average it out till 65.08 with strict stop loss of 60.30 and profit target at 75.00 and 77.60 with extension towards 85.71.
Alternate Scenario: Downward penetration of 60.30 will call for 55.50.
NOTE: ASTL is moving in an upward price channel and right now it have completed its 50% weekly correction. Daily Stochastic is trying to pullback from a horizontal supportive region.
Recommendations:
Buy above 66.85 and average it out till 65.08 with target at 75.00 and 77.60 (with extension towards 85.71 on long term bases.)
Weekly Chart with Supports and Resistances:


Leave A Comment
Required fields are marked *. Your email will not be published or shared.