BYCO Byco Petroleum Limited Analysis 20 June 2016
Rebound Insight
Byco Petroleum LimitedOil and Gas |
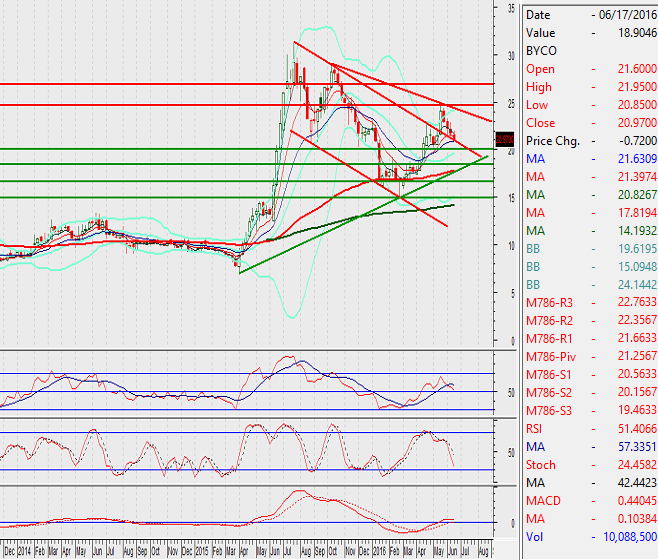
Price: 20.97Change: -0.33 2016-06-17 |
||||||
| Open: | 21.30 | 52 Week High: | 31.16 | Market Capitalization Mln: | 20505.70 | ||
|---|---|---|---|---|---|---|---|
| High: | 21.40 | 52 Week Low: | 14.85 | Outstanding Shares. Mln: | 977.86 | ||
| Low: | 20.85 | 52 Week Avg.: | 22.04 | KSE AllShares % Weight-age: | 0.27 | ||
| Close: | 20.97 | 52 Week Max Vol.: | 41296500 | KSE100 % Weight-age: | Not Listed | ||
| Average: | 21.13 | 52 Week Min Vol.: | 322500 | KSE30 % Weight-age: | Not Listed | ||
| Volume: | 1782000 | 52 Week Total Vol.: | 1931735000 | Data Last Updated: | 2016-06-17 | ||
Rebound Insight
Our Pivot: 16.65
Our Preference: Buy BYCO above 20.08 and average it out till 18.39 with strict stop loss of 16.65 and profit target at 24.20 and 24.73 with extension towards 26.90.
Alternate Scenario: Downward penetration of 16.65 will call for 14.91 and 14.20.
NOTE: BYCO is about to fulfill its weekly 50% correction and right now its getting support from supportive trend line of its bearish price channel along with a horizontal supportive region.
Recommendations
Buy above 20.08 and average it out till 16.65 with target at 24.73
Weekly Chart With Supports and Resistances:


Leave A Comment
Required fields are marked *. Your email will not be published or shared.