EFOODS Engro Foods Limited Mid-Term Analysis 10 April 2017
Rebound Insight
Engro Foods Ltd.Food Producers |
Price: 163.65Change: 2.66 2017-04-07 |
||||||
| Open: | 160.99 | 52 Week High: | 211.00 | Market Capitalization Mln: | 125453.45 | ||
|---|---|---|---|---|---|---|---|
| High: | 164.95 | 52 Week Low: | 134.00 | Outstanding Shares. Mln: | 766.60 | ||
| Low: | 160.60 | 52 Week Avg.: | 162.13 | KSE AllShares % Weight-age: | 1.32 | ||
| Close: | 163.65 | 52 Week Max Vol.: | 12710600 | KSE100 % Weight-age: | 0.51 | ||
| Average: | 162.55 | 52 Week Min Vol.: | 0 | KSE30 % Weight-age: | 0.79 | ||
| Volume: | 284400 | 52 Week Total Vol.: | 314974000 | Data Last Updated: | 2017-04-07 | ||
Rebound Insight
Our Pivot: 149
Our Preference: Buy EFOODS above 161 and average it out till 154 with strict stop loss of 149 and profit target at 174 and 190.60.
Alternate Scenario: Downward penetration of 149 will call for 141 and 137.
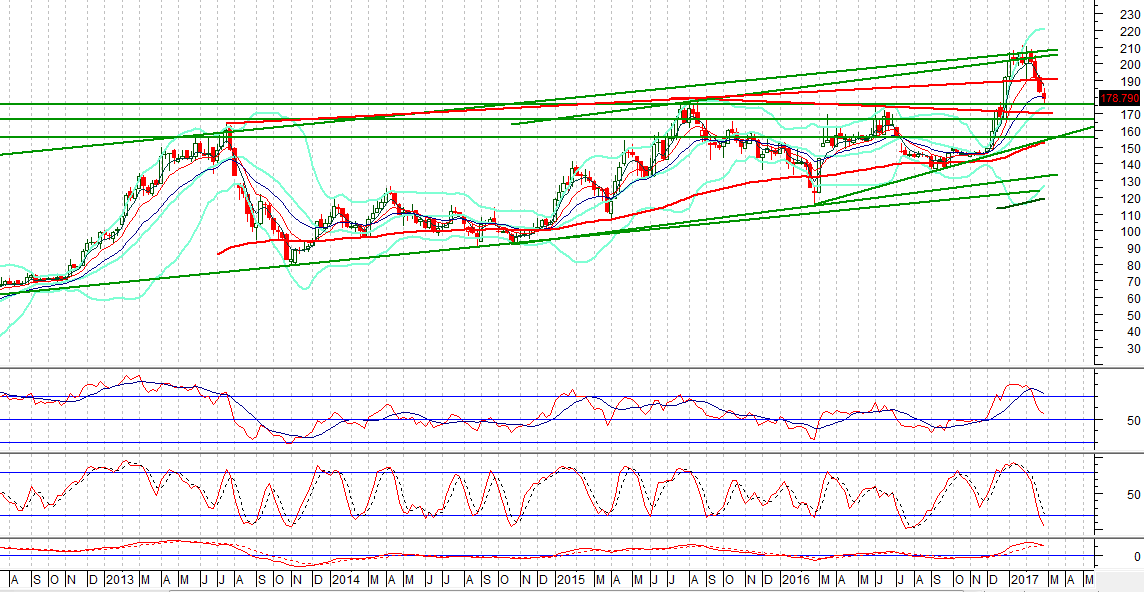
NOTE: EFOODS is moving in an upward price channel on weekly chart and right now it have fulfilled its 61.8% correction, it have strong supportive regions ahead where it will get support from a horizontal supportive region at 160.59 and 154 at its 61.8% correction and a supportive trend line .
Recommendations:
Buy above 161 and average it out till 154 with targets at 174 and 190.60.
Weekly Chart with Supports and Resistances:


Leave A Comment
Required fields are marked *. Your email will not be published or shared.