ENGRO Engro Corporation Mid-Term Analysis 13th July 2017
Rebound Insight
Engro Corporation LimitedChemicals |
Price: 314.35Change: -5.65 2017-07-12 |
||||||
| Open: | 320.00 | 52 Week High: | 403.50 | Market Capitalization Mln: | 164651.74 | ||
|---|---|---|---|---|---|---|---|
| High: | 323.49 | 52 Week Low: | 276.00 | Outstanding Shares. Mln: | 523.78 | ||
| Low: | 306.75 | 52 Week Avg.: | 334.24 | KSE AllShares % Weight-age: | 1.82 | ||
| Close: | 314.35 | 52 Week Max Vol.: | 23416800 | KSE100 % Weight-age: | 4.15 | ||
| Average: | 316.15 | 52 Week Min Vol.: | 0 | KSE30 % Weight-age: | 6.35 | ||
| Volume: | 2554500 | 52 Week Total Vol.: | 393042400 | Data Last Updated: | 2017-07-12 | ||
Rebound Insight
Our Pivot: 278
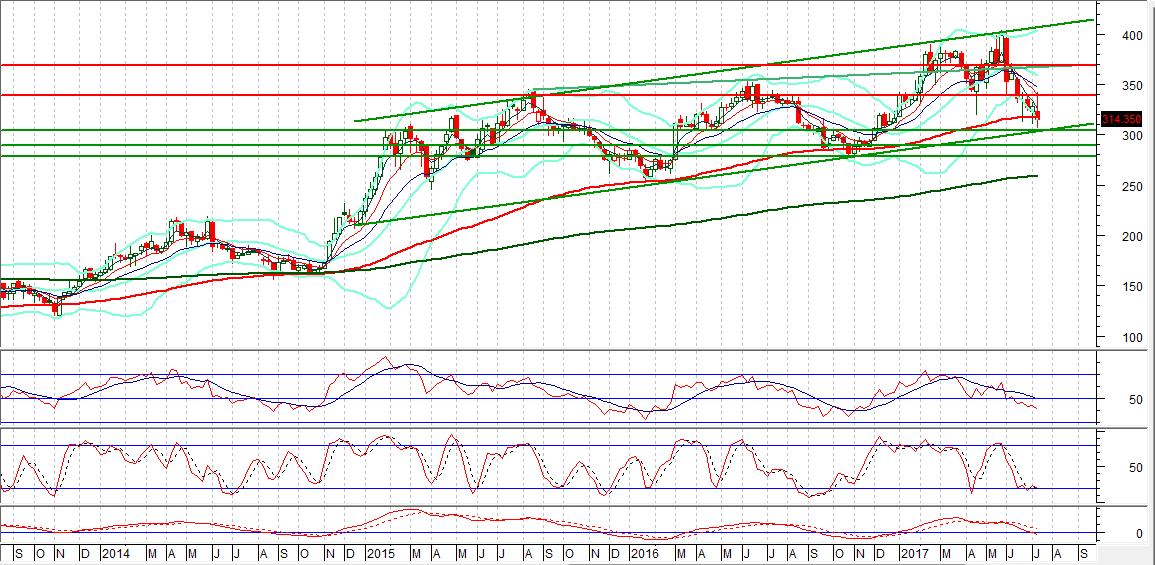
Our Preference: Buy ENGRO above 303 and average it out till 288 with strict stop loss of 278 and profit target at 338 with extension towards 353 and 370.
Alternate Scenario: Downward penetration of 278 will call for 253.
NOTE: ENGRO is getting support from rising trend line of its long-term bullish trend channel on weekly chart along with a horizontal supportive region.
Weekly Chart with Supports and Resistances:


Leave A Comment
Required fields are marked *. Your email will not be published or shared.