FFC Fauji Fertilizer Co. Ltd. Mid-Term Analysis 06 March 2017
Rebound Insight
Fauji Fertilizer Co. Ltd.Chemicals |
Price: 110.63Change: 0.62 2017-03-03 |
||||||
| Open: | 110.01 | 52 Week High: | 122.89 | Market Capitalization Mln: | 140747.71 | ||
|---|---|---|---|---|---|---|---|
| High: | 111.87 | 52 Week Low: | 102.00 | Outstanding Shares. Mln: | 1272.24 | ||
| Low: | 110.01 | 52 Week Avg.: | 110.51 | KSE AllShares % Weight-age: | 1.43 | ||
| Close: | 110.63 | 52 Week Max Vol.: | 8400900 | KSE100 % Weight-age: | 3.03 | ||
| Average: | 110.63 | 52 Week Min Vol.: | 0 | KSE30 % Weight-age: | 4.59 | ||
| Volume: | 592200 | 52 Week Total Vol.: | 354149500 | Data Last Updated: | 2017-03-03 | ||
Rebound Insight
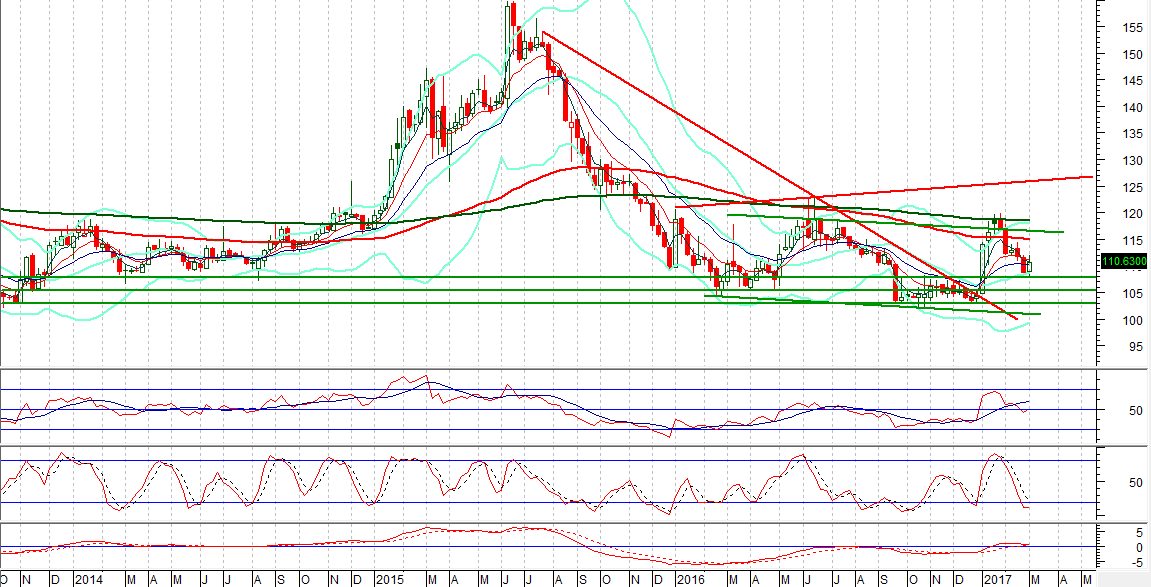
Our Pivot: 102.90
Our Preference: Buy FFC as long as 107.81 is maintained as support and average it out till 105.46 with strict stop loss of 102.90 and profit target at 116.60 and 118.45 with extension towards 125.
Alternate Scenario: Downward penetration of 102.90 will call for 101 and 100.
NOTE: FFC is bounced back after completing its 61.8% weekly correction. Weekly Stochastic and MAORSI also have started their bounce back for a bullish crossover which will push it back into bullish trend which will target 125 on mid-term bases.
Recommendations:
Buy FFC above 108.60 and average it out till 105.46 with target at 116.60 on mid term bases and 125 on long term bases.
Weekly Chart with Supports and Resistances:


Leave A Comment
Required fields are marked *. Your email will not be published or shared.