ISL Inter.Steel Ltd. Intra-day Analysis 7th July 2017
Rebound Insight
Inter.Steel Ltd.Industrial metals and Mining |
Price: 114.86Change: 0.85 2017-07-06 |
||||||
| Open: | 114.01 | 52 Week High: | 167.80 | Market Capitalization Mln: | 49964.10 | ||
|---|---|---|---|---|---|---|---|
| High: | 118.10 | 52 Week Low: | 36.30 | Outstanding Shares. Mln: | 435.00 | ||
| Low: | 112.20 | 52 Week Avg.: | 98.87 | KSE AllShares % Weight-age: | 0.54 | ||
| Close: | 114.86 | 52 Week Max Vol.: | 10751000 | KSE100 % Weight-age: | 0.90 | ||
| Average: | 114.79 | 52 Week Min Vol.: | 0 | KSE30 % Weight-age: | Not Listed | ||
| Volume: | 6277100 | 52 Week Total Vol.: | 598900600 | Data Last Updated: | 2017-07-06 | ||
Rebound Insight
Our Pivot: 110
Our Preference: Buy ISL above 113 and average it out till 111.86 with strict stop loss of 110 and profit target at 118 and 118.75.
Alternate Scenario: Downward penetration of 110 will call for 106.44.
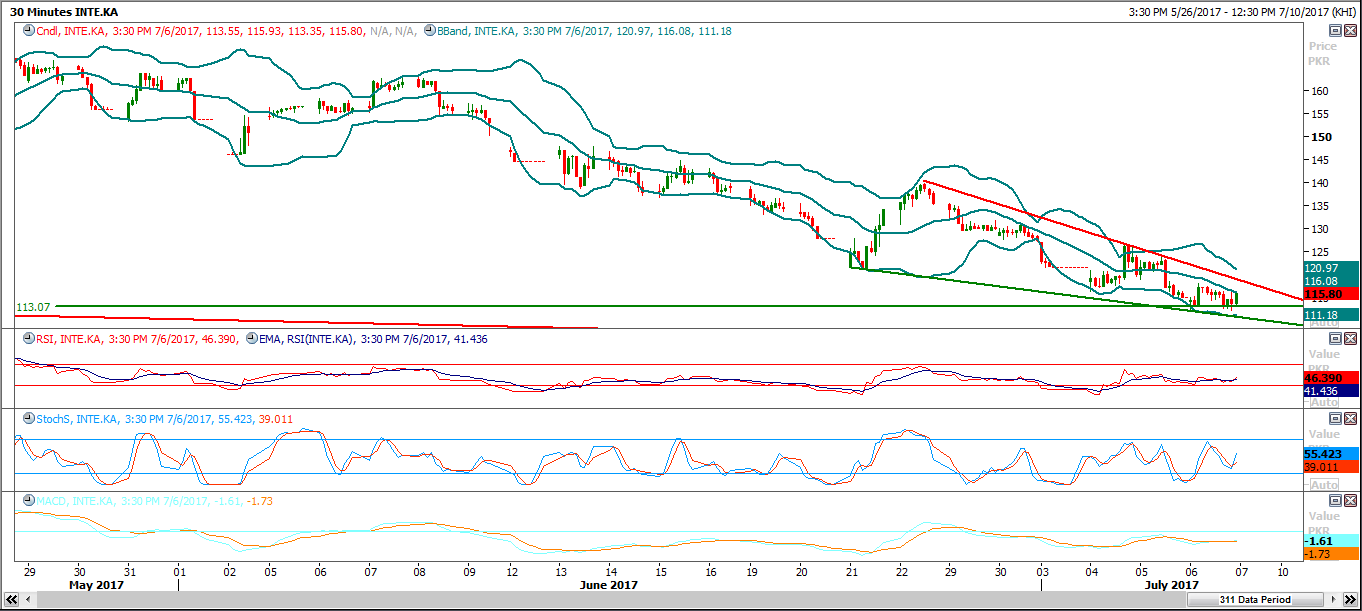
NOTE: ISL is getting support from a horizontal supportive region along with a supportive trend line on its weekly triple bottom. Hourly stochastic have generated a bullish crossover while daily is ready for a pullback.
Intra-day Chart with Supports and Resistance:


Leave A Comment
Required fields are marked *. Your email will not be published or shared.