NBP National Bank Of Pakistan Mid-Term Analysis 5th July 2017
Rebound Insight
National Bank Of PakistanCommercial Banks |
Price: 58.44Change: 1.38 2017-07-04 |
||||||
| Open: | 57.06 | 52 Week High: | 83.64 | Market Capitalization Mln: | 124331.85 | ||
|---|---|---|---|---|---|---|---|
| High: | 58.60 | 52 Week Low: | 56.50 | Outstanding Shares. Mln: | 2127.51 | ||
| Low: | 57.00 | 52 Week Avg.: | 70.81 | KSE AllShares % Weight-age: | 1.34 | ||
| Close: | 58.44 | 52 Week Max Vol.: | 13322000 | KSE100 % Weight-age: | 1.31 | ||
| Average: | 57.78 | 52 Week Min Vol.: | 0 | KSE30 % Weight-age: | 2.00 | ||
| Volume: | 993500 | 52 Week Total Vol.: | 550214000 | Data Last Updated: | 2017-07-04 | ||
Rebound Insight
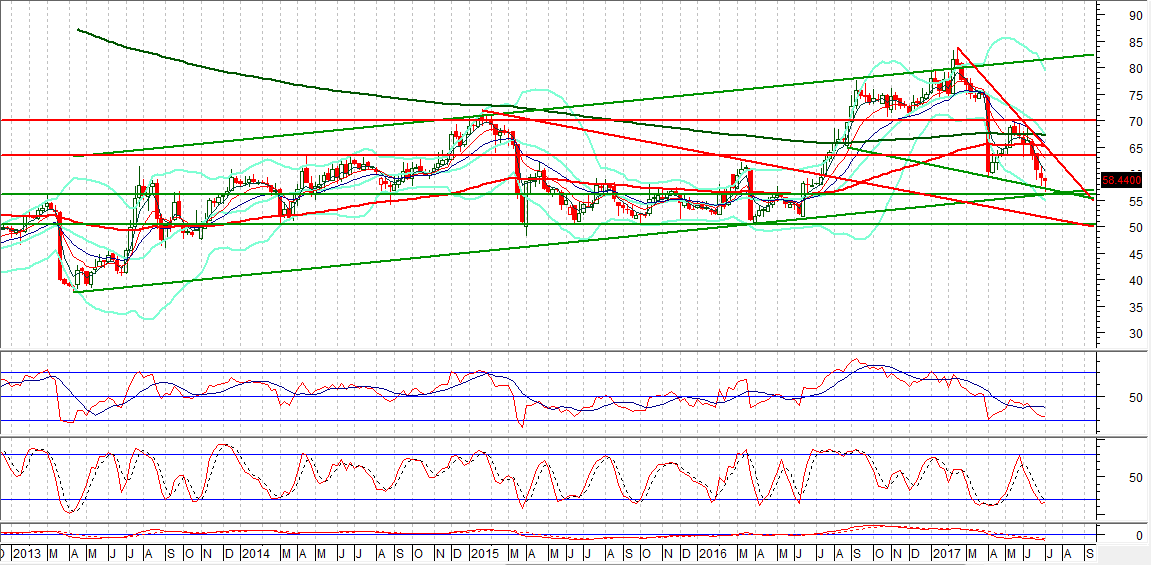
Our Pivot: 49.50
Our Preference: Start buying NBP above 56 and average it out till 53.27 with strict stop loss of 49.50 and profit target at 63 and 70.
Alternate Scenario: Downward penetration of 49.50 will call for 48.60 and 45.40.
NOTE: NBP is getting support from supportive trend line of its bullish trend channel on weekly chart along with a horizontal supportive region. Daily Stochastic and MAORSI have generated bullish crossover while weekly stochastic is ready for a pull back.
Weekly Chart with Supports and Resistances:


Leave A Comment
Required fields are marked *. Your email will not be published or shared.