SSGC Sui Southern Gas Co Ltd Mid-Term Analysis 26 Dec. 2016
Rebound Insight
Sui Southern Gas Co. Ltd.Multiutilities (Gas and water) |
Price: 35.68Change: -0.37 2016-12-23 |
||||||
| Open: | 36.05 | 52 Week High: | 49.34 | Market Capitalization Mln: | 31431.10 | ||
|---|---|---|---|---|---|---|---|
| High: | 36.49 | 52 Week Low: | 23.97 | Outstanding Shares. Mln: | 880.92 | ||
| Low: | 35.36 | 52 Week Avg.: | 33.04 | KSE AllShares % Weight-age: | 0.34 | ||
| Close: | 35.68 | 52 Week Max Vol.: | 30384500 | KSE100 % Weight-age: | 0.39 | ||
| Average: | 35.90 | 52 Week Min Vol.: | 460000 | KSE30 % Weight-age: | 0.59 | ||
| Volume: | 3315000 | 52 Week Total Vol.: | 1464462500 | Data Last Updated: | 2016-12-23 | ||
Rebound Insight
Our Pivot: 30.92
Our Preference: Buy above 35 and average it out till 33.22 with strict stop loss of 30.92 and profit target at 41.94 with extension towards 44.76.
Alternate Scenario: Downward penetration of 30.92 will call for 26.14.
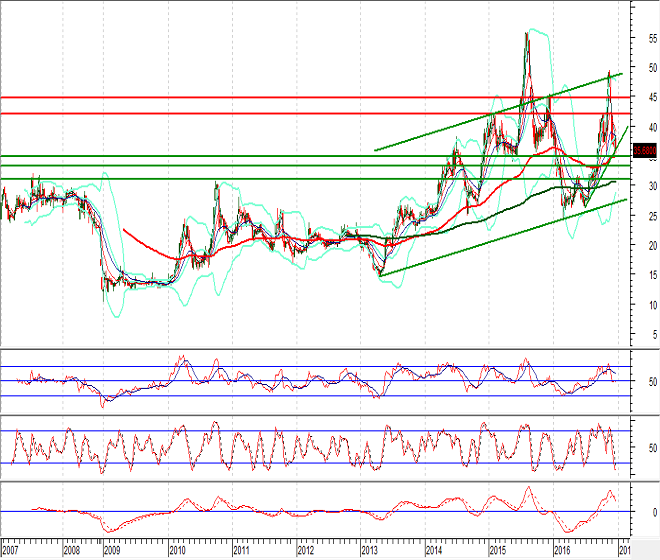
NOTE: SSGC have dropped by 25.09% in one month while completing its 61.8% correction on weekly chart and right now its getting support from a rising trend line on its retracement level along with a horizontal supportive region. Weekly Stochastic is trying to generate a bullish crossover which can push it back towards 41.94.
Recommendations:
Buy above 35 Rs and average it out till 33.22 with strict stop loss of 30.92 and target at 41.94.
Weekly Chart with Supports and Resistances:


Leave A Comment
Required fields are marked *. Your email will not be published or shared.