TRG The Resources Group of Pakistan Intraday Analysis 03 April 2017
Further Advance
TRG PakistanSupport Services |
Price: 52.08Change: 2.38 2017-03-31 |
||||||
| Open: | 49.70 | 52 Week High: | 63.89 | Market Capitalization Mln: | 28403.95 | ||
|---|---|---|---|---|---|---|---|
| High: | 52.44 | 52 Week Low: | 29.80 | Outstanding Shares. Mln: | 545.39 | ||
| Low: | 48.85 | 52 Week Avg.: | 42.62 | KSE AllShares % Weight-age: | 0.30 | ||
| Close: | 52.08 | 52 Week Max Vol.: | 58302000 | KSE100 % Weight-age: | 0.98 | ||
| Average: | 50.77 | 52 Week Min Vol.: | 0 | KSE30 % Weight-age: | 1.50 | ||
| Volume: | 16490500 | 52 Week Total Vol.: | 3379723500 | Data Last Updated: | 2017-03-31 | ||
Further Advance
Our Pivot: 50.60
Our Preference: Buy TRG above 52 and average it out till 51.78 with strict stop loss of 50.65 and target at 53.70 and 54.10.
Alternate Scenario: Downward penetration of 50.65 will call for 49.90 and 49.60.
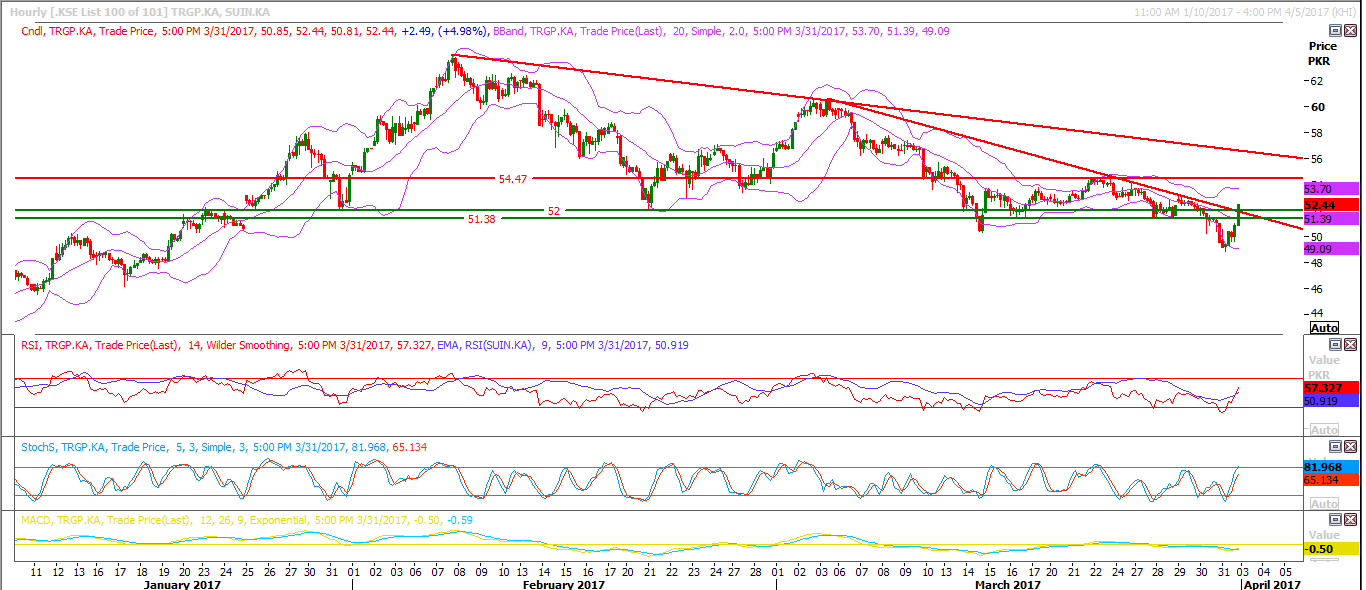
NOTE: TRG have a good prospect on Intraday bases for current trading session as it have generated a bullish engulfing on daily chart and it also have penetrated a bearish trend line on intraday chart. It will face resistance around 53.60 and 54.10 on Intraday bases
Recommendations:
Buy above 52 and average it out till 51.78 with strict stop loss of 50.65 and target at 53.70 and 54.10.
Hourly Chart with Supports and Resistances:


Leave A Comment
Required fields are marked *. Your email will not be published or shared.