TRG The Resources Group of Pakistan Mid-Term Aanlysis 6th July 2017
Rebound Insight
TRG PakistanSupport Services |
Price: 36.14Change: -1.56 2017-07-05 |
||||||
| Open: | 37.70 | 52 Week High: | 63.89 | Market Capitalization Mln: | 19710.42 | ||
|---|---|---|---|---|---|---|---|
| High: | 39.02 | 52 Week Low: | 33.70 | Outstanding Shares. Mln: | 545.39 | ||
| Low: | 36.10 | 52 Week Avg.: | 46.79 | KSE AllShares % Weight-age: | 0.21 | ||
| Close: | 36.14 | 52 Week Max Vol.: | 58302000 | KSE100 % Weight-age: | 0.74 | ||
| Average: | 37.24 | 52 Week Min Vol.: | 0 | KSE30 % Weight-age: | 1.13 | ||
| Volume: | 17431000 | 52 Week Total Vol.: | 3332305500 | Data Last Updated: | 2017-07-05 | ||
Rebound Insight
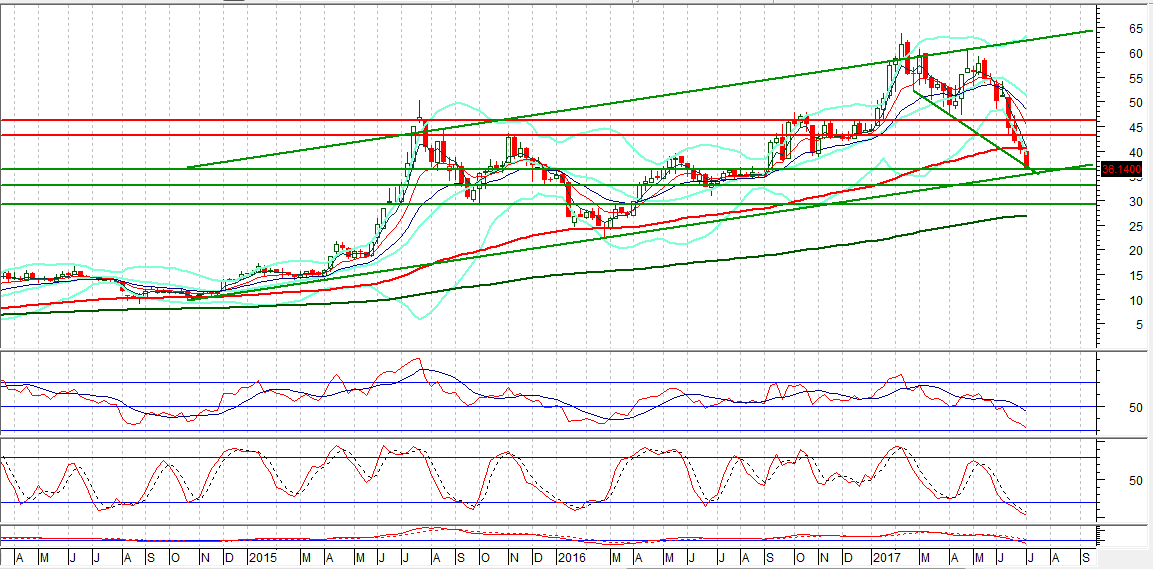
Our Pivot: 29.31
Our Preference: Buy TRG above 35 and average it out till 33.10 with strict stop loss of 29.31 and target at 43.22 with extension towards 46.13
Alternate Scenario: Downward penetration of 29.31 will call for 26.40.
NOTE: TRG is getting supportive trend line of its bullish channel on weekly chart along with a bearish supportive trend line. Weekly Stochastic is ready for a pullback which can push it back for a correction of its bearish rally.
Daily Chart with Supports and Resistances:


Leave A Comment
Required fields are marked *. Your email will not be published or shared.