TRG The Resources Group of Pakistan Analysis 30th May 2017
Rebound Insight
TRG PakistanSupport Services |
Price: 52.64Change: -0.86 2017-05-29 |
||||||
| Open: | 53.50 | 52 Week High: | 63.89 | Market Capitalization Mln: | 28709.36 | ||
|---|---|---|---|---|---|---|---|
| High: | 54.40 | 52 Week Low: | 30.81 | Outstanding Shares. Mln: | 545.39 | ||
| Low: | 51.79 | 52 Week Avg.: | 45.64 | KSE AllShares % Weight-age: | 0.28 | ||
| Close: | 52.64 | 52 Week Max Vol.: | 58302000 | KSE100 % Weight-age: | 0.94 | ||
| Average: | 53.08 | 52 Week Min Vol.: | 0 | KSE30 % Weight-age: | Not Listed | ||
| Volume: | 7101500 | 52 Week Total Vol.: | 3248796500 | Data Last Updated: | 2017-05-29 | ||
Rebound Insight
Our Pivot: 49.80
Our Preference: Buy TRG above 51.89 and average it out till 50.44 with strict stop loss of 49.80 and target at 54.70 and 56.80.
Alternate Scenario: Downward penetration of 49.80 will call for 47.90.
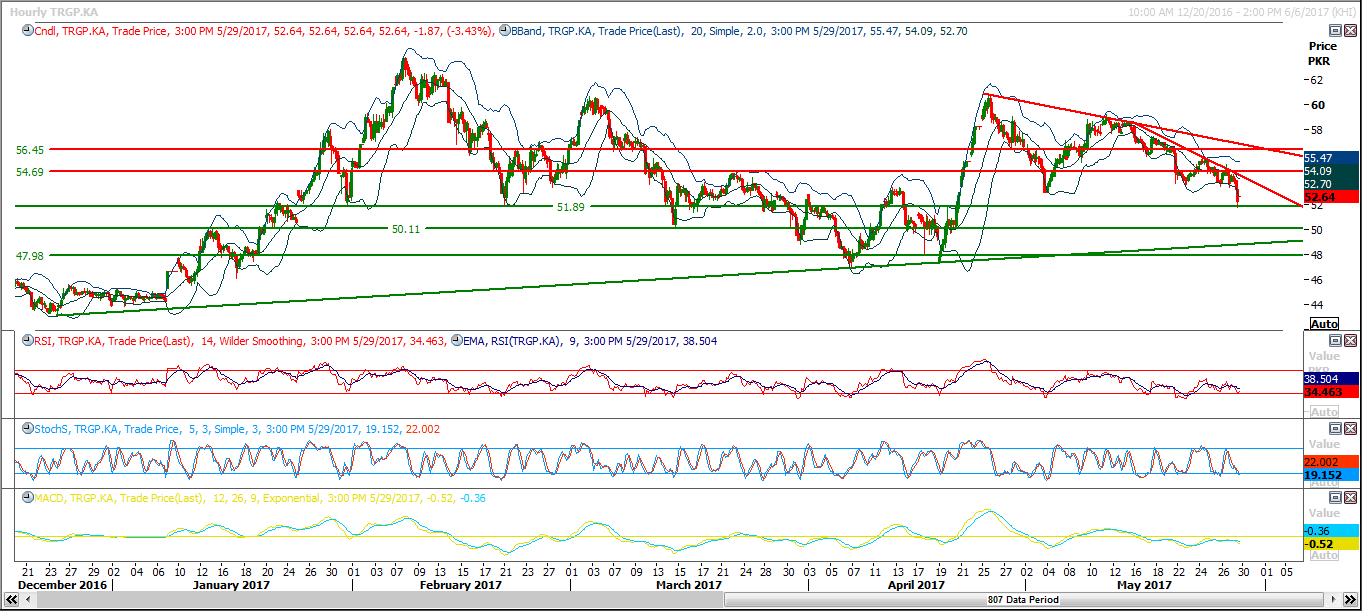
NOTE: TRG is getting support from a rising trend line on weekly chart at its 61.8% bullish correction and it also have a strong supportive region ahead at 50 Rs which could push it back into bullish trend. On hourly chart it have filled its previous gap and right now its expected that it would start a bounce back from 51.89 or 50.44.
Recommendations:
Buy above 51.89 and average it out till 50.44 with strict stop loss of 49.80 and target at 54.70 and 56.80.
Hourly Chart with Supports and Resistances:


Leave A Comment
Required fields are marked *. Your email will not be published or shared.