TRG The Resources Group of Pakistan Short-Term Aanlysis 19th June 2017
Rebound Insight
TRG PakistanSupport Services |
Price: 44.59Change: 0.28 2017-06-16 |
||||||
| Open: | 44.31 | 52 Week High: | 63.89 | Market Capitalization Mln: | 24319.00 | ||
|---|---|---|---|---|---|---|---|
| High: | 45.10 | 52 Week Low: | 30.81 | Outstanding Shares. Mln: | 545.00 | ||
| Low: | 43.71 | 52 Week Avg.: | 46.48 | KSE AllShares % Weight-age: | 0.26 | ||
| Close: | 44.59 | 52 Week Max Vol.: | 58302000 | KSE100 % Weight-age: | 0.89 | ||
| Average: | 44.43 | 52 Week Min Vol.: | 0 | KSE30 % Weight-age: | Not Listed | ||
| Volume: | 5027000 | 52 Week Total Vol.: | 3265641000 | Data Last Updated: | 2017-06-16 | ||
Rebound Insight
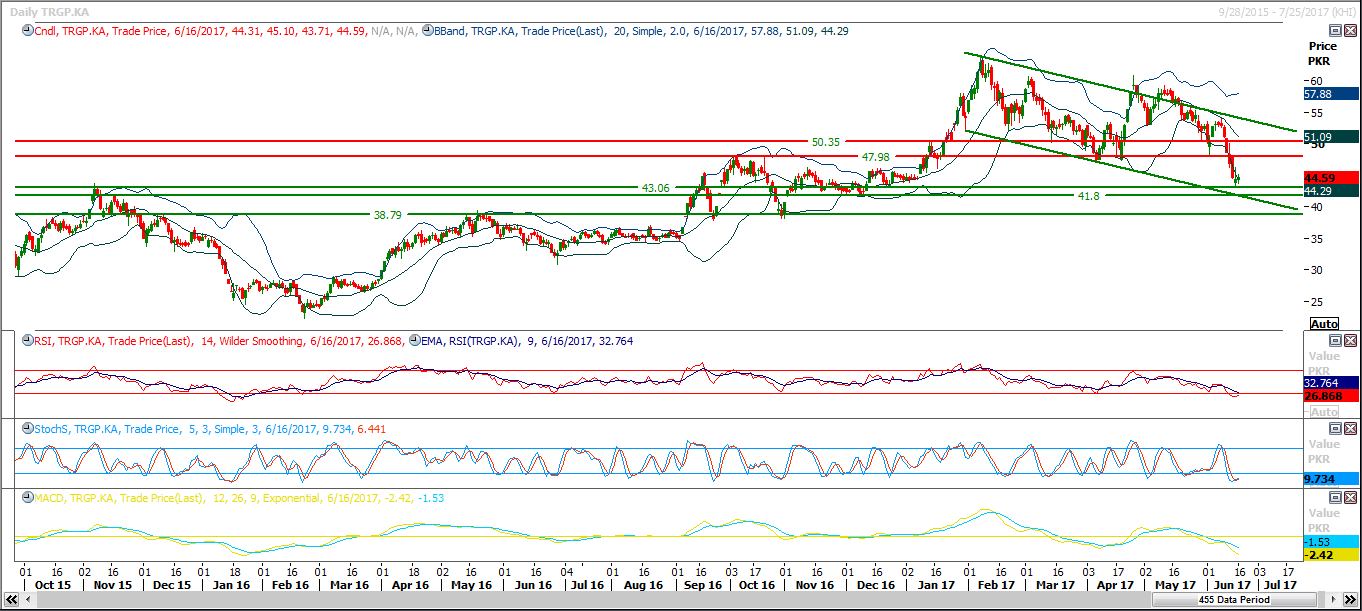
Our Pivot: 38.80
Our Preference: Buy TRG above 43.06 and average it out till 41.80 with strict stop loss of 38.80 and target at 47.90 and 49.35.
Alternate Scenario: Downward penetration of 38.80 will call for 36.30.
NOTE: TRG is getting support from a supportive trend line along with a horizontal supportive region. Daily stochastic and MAORSI are ready for a bullish crossover which could push it back towards 47.90.
Recommendations:
Buy above 43.06 and average it out till 41.80 with strict stop loss of 38.80 and target at 47.90 and 49.35.
Daily Chart with Supports and Resistances:


Leave A Comment
Required fields are marked *. Your email will not be published or shared.